“More Than Half a Million Extra Deaths” Every Year In U.S.

A previous blog post (Life Expectancy Dropping in U.S.) showed an alarming trend in which the life expectancy in the U.S. has dropped to about 76 years, nearly 6 years lower than peer countries

This article discusses this topic further. David Wallace-Wells, NY Times 8/9/23: Why Is America Such a Deadly Place? An excerpt:

“Life expectancy in the United States took an unprecedented turn for the worse, placing it not among its wealthy peers, but below Kosovo, Albania, Sri Lanka and Algeria (and just ahead of Panama, Turkey and Lebanon)…

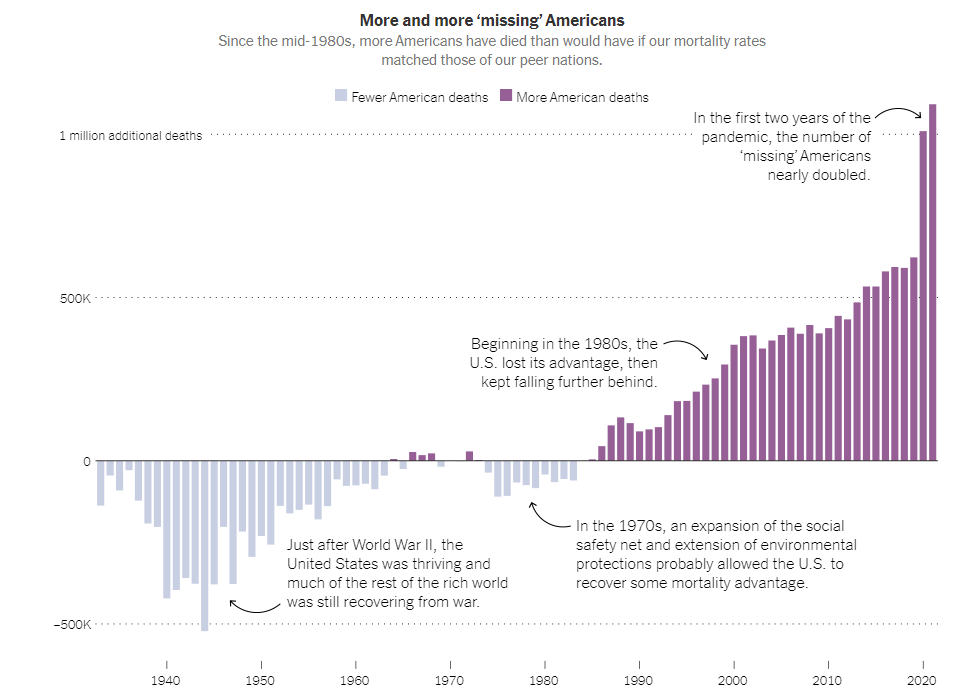
But the loss is jaw-dropping by another measure — the sheer number of needless deaths. Before the pandemic, roughly a half million more people in America died each year than would have died, on average, in wealthy peer countries. In each of the first two years of the pandemic, the number surpassed one million….

The much larger American anomaly is its deaths among the young and middle-aged — among whom violent deaths, in particular, subtract many more years of life than would almost any natural cause of death, which overwhelmingly strikes much later in life.”

The article describes areas with excess deaths including the following:

  • Overdose deaths
  • Gun-related deaths (accidents, suicides, and homicides)
  • Excess car deaths
  • Accidents (including increased deaths from fires and drowning)
  • Maternal deaths during childbirth
  • Deaths related to chronic disease including diabetes (associated with obesity)

My take: The excess number of U.S. population dying every year is staggering and sadly, little is being done to change it.

COVID-19 -New Infection Fatality Data & How to Fix the Testing Mess

From Annals of Internal Medicine 2020 https://doi.org/10.7326/M20-5352: J Blackburn et al. Full Text: Infection Fatality Ratios for COVID-19 Among Noninstitutionalized Persons 12 and Older: Results of a Random-Sample Prevalence Study

Background: Mortality rates have been calculated from confirmed cases, which overestimates the infection fatality ratio (IFR). To calculate a true IFR, population prevalence data are needed from large geographic areas where reliable death data also exist.

Results: The Table below suggests IFR of 0.01% for those <40, 0.12% for those 40-59, and 1.71% for those ≥60 in noninstitutionalized persons.  The Table indicates nearly a 3-fold increase risk in Non-White persons. Whites had an IFR of 0.18%; non-Whites had an IFR of 0.59%. Also, I think the Table incorrectly suggests that Females have a higher IFR than Males (but the numbers suggest that they are equivalent).

From The New Yorker, Atul Gawande: We Can Solve the Coronavirus-Test Mess Now—If We Want To

This is a lengthy article which describes some of the mistakes that we’ve made with testing, some of the technical details with various tests, pooled testing, at-home testing, wastewater testing, and how to fix testing (including assurance testing) to gain control of this pandemic.

An excerpt:

We could have the testing capacity we need within weeks. The reason we don’t is not simply that our national leadership is unfit but also that our health-care system is dysfunctional….

In the United States, getting a test is anything but easy…[And] through early August, results routinely took four days or more, making the tests essentially useless. 

Assurance testing” has been required by countries such as IcelandFrance, and Germany for travellers from abroad in order to avoid a mandatory two-week quarantine

What’s More Important: Improving Mortality Rate or Survival Rate? (Hint: It is not a trick question)

A recent commentary by Aaron E. Carroll in the NY Times explains “Why Survival Rate is Not the Best Way to Judge Cancer Spending.”  If you don’t understand the difference between survival rate and mortality rate, then it is worth a quick read; it explains the concept of “lead-time bias” and “overdiagnosis bias.” Here’s an excerpt:

Mortality rates are determined by taking the number of people who die of a certain cause in a year and dividing it by the total number of people in a population…

Survival rates describe the number of people who live a certain length of time after a diagnosis…

Let’s consider a hypothetical illness, thumb cancer. We have no method to detect the disease other than feeling a lump. From that moment, everyone lives about four years with our best therapy. Therefore, the five-year survival rate for thumb cancer is effectively zero, because within five years of detection, everyone dies.

Now, let’s assume that we develop a new scanner that can detect thumb cancer five years earlier. We prevent no more deaths, mind you, because our therapy hasn’t improved. Everyone now dies nine years after detection instead of four. The five-year survival rate is now 100 percent.