Worldwide Increase in Sugar-Sweetened Beverage Intake

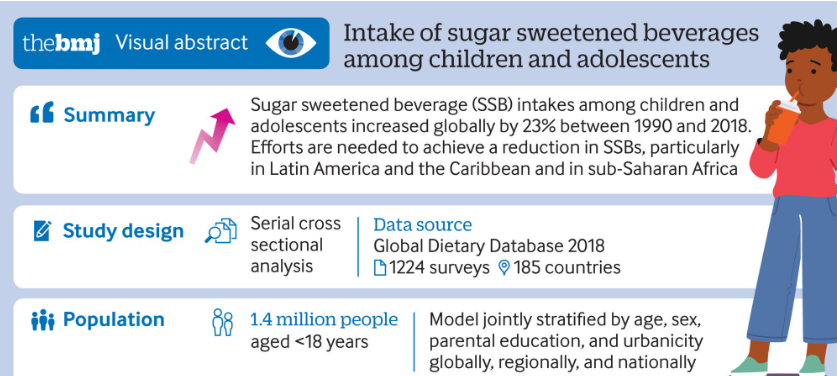
L Lara-Castor et al. BMJ 2024;386:e079234. Open Access! Intake of sugar sweetened beverages among children and adolescents in 185 countries between 1990 and 2018: population based study

Key findings:

  • Intakes of SSBs among children and adolescents aged 3-19 years in 185 countries increased by 23% (0.68 servings/week (0.54 to 0.85)) from 1990 to 2018, parallel to the rise in prevalence of obesity among this population globally
  • High income countries experienced an overall decrease in intakes of SSBs from 2005 to 2018. This might be explained by the increasing scientific and public health attention on the harms of SSBs as well as obesity in these nations during this period, which may have led to increased media and public awareness about the harms to health associated with SSBs
National mean intakes of SSBs (standardized 248 g (8 oz) serving/week for this analysis) in children and adolescents aged 3-19 years across 185 countries in 2018. SSBs were defined as any beverage with added sugars and ≥209 kJ (50 kcal) per 237 g serving, including commercial or homemade beverages, soft drinks, energy drinks, fruit drinks, punch, lemonade, and aguas frescas. This definition excludes 100% fruit and vegetable juices, non-caloric artificially sweetened drinks, and sweetened milk

My take: Despite the knowledge that sugary beverages are detrimental, consumption continues to increase.

Related blog posts:

Newsworthy Tweets: Climate Change, Sugary Beverage Laws, Increasingly Uninsured Children, and Flu Vaccine Effectiveness

Climate change:

Related blog posts:

Sugary beverage Law:

Related blog posts –Sugary Beverages/Diet:

Related blog posts –Health Insurance:

Getting the Most Out of Vedolizumab

A recent cross-sectional study (B Al-Bawardy et al. Inflamm Bowel Dis 2019; 25: 580-6) correlated vedolizumab (VDZ) trough drug levels (VDT) and clinical outcomes in 171 patients (62% Crohn’s disease (CD), 31% ulcerative colitis (UC), and 7% indeterminate colitis (IC)).

Key findings:

  • Median VDT was 15.3 microgr/mL.
  • Median VDT was 17.3 microgr/mL for patients with normal CRP compared with 10.7 for patients with high CRP.  This differnece was noted significantly for CD (20.3 vs 10.4) but not for UC.
  • No relationship  between VDT and mucosal healing was noted.
  • Shorter dose intervals and lower BMO resulted in higher VTLs
  • Only 1 patient had detectable antibodies to VDZ

A second systematic review (L Peyrin-Biroulet et al. Clin Gastroenterol Hepatol 2019; 17: 838-46) analyzed data from 10 cohorts who had received vedolizumab.  Most had prior anti-TNF exposure. Key finding: the pooled incidence rates of loss of response were 47.9 per 100 person-years of follow up among patients with CD and 39.8 per 100 person-years of follow up among patinets with UC.  Dose intensification restored response to the drug in 53.8% of secondary non-responders.

My take: While VDZ dose intensification can restore response, the utility of therapeutic drug monitoring is unclear with VDZ therapy.

Related blog posts: