Kids With Acute Pancreatitis Need Followup

F Ahmed, M Abu-El-Haija. Gastroenterol 2025; 169: 572-584. Open Access! Acute Pancreatitis in Children: It’s Not Just a Simple Attack

This is a really good review of acute pancreatitis covering epidemiology, diagnosis, severity classification, management, microbiome/metabolite derangements, genetics, and complications. Most of these topics have been covered in numerous blog posts (see below).

Selected Key Points:

  • Diagnostic testing -Amylase/Lipase:  “The diagnostic efficacy of amylase for AP, in terms of sensitivity and specificity, is contingent on the selected threshold value. Elevating the cut-off point to 1000 IU/L results in a high specificity of approximately 95%. However, this comes at the cost of reduced sensitivity, which some studies report to be as low as 61%… the activity of serum lipase remains elevated for a longer duration, typically between 8 and 14 days,… Lipase demonstrates superior accuracy with most studies reporting specificities exceeding 95% and sensitivities ranging from 55%–100% at a threshold activity level of 600 IU/L…hese tests have excellent sensitivities, they may have a few limitations such as being poor predictors of severity”
  • Risk Factors in Children (from Figure 1):
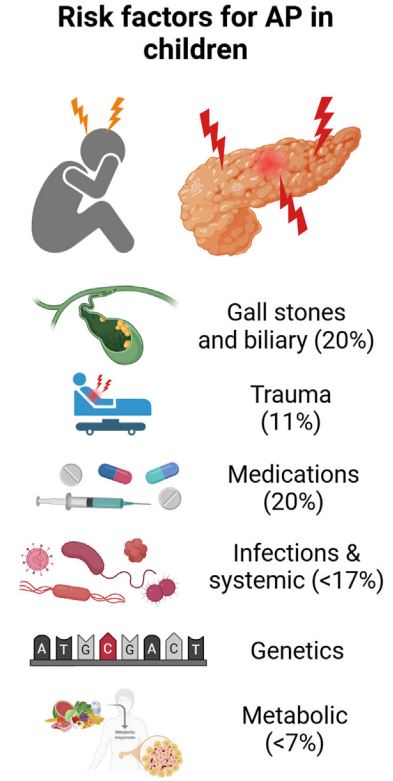
  • Incidence and Severity in Children (from Figure 1):

[At a recent lecture, Jay Freeman (How to Upgrade Pancreas Care –Jay Freeman MD (Part 1)) noted that severe pancreatitis is often defined by degree of organ dysfunction (eg. cardiac, pulmonary, renal). A practical definition of severe pancreatitis in children is whether the patient requires admission to an ICU]

  • Diagnostic testing -Imaging: “Imaging techniques are crucial for diagnosing and managing AP in children…NASPGHAN) and the Society for Pediatric Radiology formed consensus guidelines where transabdominal ultrasonography was recommended as the primary imaging technique for pediatric cases with suspected AP…Recent studies in the pediatric population have indicated that US’s sensitivity for AP detection ranges from 47%–52%.25Magnetic resonance cholangiopancreatography (MRCP) is useful for anatomical assessment without radiation but may require sedation”
  • Management: “The cornerstones of therapy are early feeding and intravenous fluids… Allowing patients to eat on admission was feasible and was associated with lower length of stay. Rates of intravenous fluids are recommended at 1.5–2 times maintenance rates,49 and the preferred fluid is Lactated Ringer’s due to limited studies including a recent randomized controlled study that showed that Lactated Ringer’s was associated with a faster discharge rate when administered compared with normal saline.50
  • Genetics:  “A recently conducted study investigated the importance of genetics in pediatric AP patients…use of an extensive panel of 8 genes… PRSS1CFTRSPINK1CPA1, CTRCCLDN2CASR, and SBDS… genetics is a major component in all types of pancreatitis in children, with genetic variants being most prevalent in CP cases at 31%, followed by AP at 19%, and ARP at 6%. A key discovery was that variants in SPINK1CFTR, or PRSS1 genes were associated with faster progression from first episode of AP toward CP.53
  • Complications (from Figure 1): “After the first episode of AP, the QoL is decreased, and it may lead to other disorders such as exocrine dysfunction, endocrine dysfunction and diabetes, nutritional deficiencies, and acute recurrent pancreatitis and CP.”

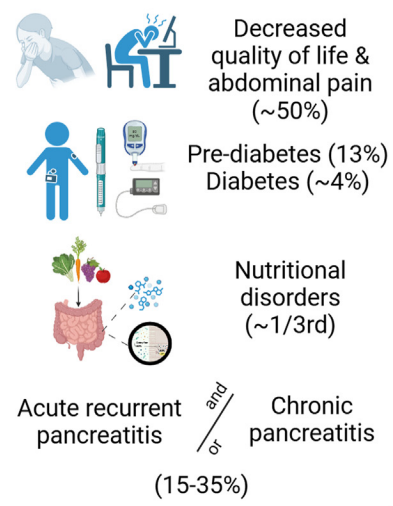
My take: Even after a single episode of acute pancreatitis, there are risks for long-term complications and patients need to follow-up.

Related blog posts:

Here’s the Data: Endocrine Insufficiency After Acute Pancreatitis in Children

M Abu-El-Haija et al. Clin Gastroenterol Hepatol 2024; 22: 2033-2043. Open Access! The Role of Pancreatitis Risk Genes in Endocrine Insufficiency Development After Acute Pancreatitis in Children

In this observational prospective cohort with 114 children (after excluding 6), outcomes following the first episode of acute pancreatitis (AP) were determined. In addition, pancreatitis risk genes (CASRCELCFTRCLDN2CPA1CTRCPRSS1SBDSSPINK1, and UBR1) were sequenced. A genetic risk score was derived from all genes with univariable P < .15.

Pre-DM was defined as follows: fasting blood glucose ≥100 mg/dL and <126 mg/dL, or hemoglobin A1C ≥5.7% and <6.5%

Key findings:

  • 95/114 (83%) remained normoglycemic and 19/114 (17%) developed endocrine insufficiency (4 DM, 15 pre-DM) 12 months after the first episode of AP
  • Sixty-three subjects (52.5%) had at least 1 reportable variant identified
  • Severe AP (58% vs 20%; P = .001) and at least 1 gene affected (79% vs 47%; P = .01) were enriched among the endocrine-insufficient group
  • CFTR (53%), SPINK1 (13%), PRSS1 (10%), and UBR1 (9%) accounted for the majority of variants identified

My take: 3.5% of this cohort developed diabetes and 13% developed prediabetes. The risk is increased in those with severe acute pancreatitis and underlying genetic variants. As noted recently with Dr. Freeman’s lecture (summarized on prior blog posts), it is worthwhile for patients to follow-up after an episode of acute pancreatitis.

Related blog posts:

Online Aspen Webinar (Part 6) -NAFLD and NASH

Aspen Online Webinar July  14-16, 2020

Below I’ve included some of my notes and slides.  There may be errors of omission or transcription.

What’s Hot? NAFLD and NASH Stavra Xanthakos

  • Fatty liver disease burden of NAFLD and NASH is increasing.  This increases the rate of cirrhosis, liver cancer and liver transplantation; the latter is being needed at younger ages
  • Explained that “Lean” (normal BMI) NAFLD is common
  • Diabetes is strongest risk factor for severe fatty liver disease (NASH or fibrosis). PNPLA3 is genetic risk factor for NAFLD risk.
  • Discussed treatment, particularly diet  and bariatric surgery.  Stated that some emerging treatments look promising.
  • In those with suspected NAFLD, Dr. Xanthokos recommends liver biopsy, if lifestyle therapy is ineffective, under specific circumstances: prior to bariatric surgery, in some cases to determine severity, and prior to instituting therapy (eg Vitamin E)


Related blog posts:

Days of Future Past and Declining Liver Graft Quality

In the most recent ‘X-men’ movie (Days of Future Past), the disastrous future is averted by having Wolverine go back in time to correct a mistake. Overall, while there are a good number of movies that have used this trick, this particular movie is pretty clever. For whatever reason, this movie came to mind as I was reading a recent study: “Declining Liver Graft Quality Threatens the Future of Liver Transplantation in the United States” (ES Orman et al. Liver Transpl 2015; 21: 1040-50).  The authors extrapolate data from UNOS to assess what the liver transplantation (LT) picture may look like in 2030. Their results/conclusion:

“If donor liver utilization practices remain constant, utilization will fall from 78% to 44% by 2030, resulting in 2230 fewer LTs.”  “The transplant community will need to accept inferior grafts and potentially worse post transplant outcomes and/or develop new strategies for increasing organ donation.”

The authors note that the national epidemics of diabetes and obesity will result in more cases of NAFLD-related liver failure while at the same time worsen the quality of available grafts. In the associated editorial, (RH Wiesner, pages 1011-12) the author emphasizes that the future is not quite so set.

  • the prevalence of diabetes and obesity in donors for 2030 might not be as great as feared; in addition, medical/surgical advances may diminish the complications associated with obesity
  • there will be a marked decrease in transplants due to hepatitis C virus related cirrhosis and hepatocellular cancer

His conclusion: “in the future, we will be using donor livers that we have never used before and will be achieving similar excellent results as we have today.” Which vision of the liver transplantation future is correct?

Related blog post: AASLD/NASPGHAN 2014 Guidelines for Evaluation of Pediatric …

Bison, Yellowstone

Bison, Yellowstone

Can Apple Make Research Cool?

For anyone who has looked at Apple’s March presentation, there is big news with regard to research (thanks to Seth for this information).  Here’s a link to the March announcement –around minute 16 there is the research presentation: Apple March Event

Screenshot: Rationale for Apple iPhone for Research -Large Research Pool

Screenshot: Rationale for Apple iPhone for Research -Large Research Pool

The presentation makes it clear that Apple wants to dramatically increase the participation in research studies by leveraging 700 million iPhone users.  Using an app called, “ResearchKit”, Apple has partnered with leading academic centers to help study Parkinson’s, Diabetes, Asthma, Cardiovascular disease, and Breast Cancer.  For the GI community, I hope that someone will work collaboratively to add inflammatory bowel disease to the list.

Besides increased participation, iPhone-based research has the ability to lower research costs, collect data at frequent intervals, and allow a wider demographic representation.

A shorter ~4 minute video on a separate area of the website explains ResearchKit: ResearchKit video

 Screenshot: Research Kit


Screenshot: ResearchKit

NBC News provides a condensed summary along with the caveat that there will be concerns about accuracy of data collected with ResearchKit.  That being said, most critics have not always appreciated the impact of previous Apple innovations.

Has someone from our national organization (NASPGHAN) or from ImproveCareNow started working with Apple? If not, this looks like a great opportunity.

Walking with a “Z” or an “X”

In a number of media outlets, there has been a push for a highly successful (and under appreciated) treatment: walking.

Advantages:

  • No/Low cost
  • Easy
  • Often fun
  • Excellent side effect profile

Here’s a link (Every Body Walk!) and here’s an excerpt:

Researchers have discovered a “wonder drug” for many of today’s most common medical problems, says Dr. Bob Sallis, a family practitioner at a Kaiser Permanente clinic in Fontana, California. It’s been proven to help treat or prevent diabetes, depression, breast and colon cancer, high blood pressure, cardiovascular disease, obesity, anxiety and osteoporosis, Sallis told leaders at the 2013 Walking Summit in Washington, D.C.

“The drug is called walking,” Sallis announced. “Its generic name is physical activity.”

Recommended dosage is 30 minutes a day, five days a week, but children should double that to 60 minutes a day, seven days a week. Side effects may include weight loss, improved mood, improved sleep and bowel habits, stronger muscles and bones as well as looking and feeling better.

Comment: If only “walking” was marketed better.  Physicians know that successful treatments need to have an “x” or a “z” or both to really do well (“X and Z in favor”).


Pancreas Transplantation -Moving Personal Story

A recent lengthy article describes the story of one man’s wait and ordeal after pancreas transplantation (due to diabetes).  This article, written as a first-person account by a Cincinnati reporter, provides a detailed view from the patient’s viewpoint of both medical aspects and the social/emotional aspects of undergoing a transplantation.

Here’s the link, from USA Today: John Faherty, “How an Organ Transplantation Changed My Life.”

Breakfast: a marker for heart-healthy habits

Summary of study (Circulation 2013; 128: 337-343) from Epocrates (emphasis in blue by blog):

Study Question:
Is eating breakfast or not associated with risk for coronary heart disease (CHD) among men residing in the United States?
Methods:
Data for this analysis were from the Health Professionals Follow-up Study, an ongoing prospective study of male health professionals. Approximately 97% of participants were of white European descent. Eating habits, including breakfast eating, were assessed in 1992 in 26,902 American men, ages 45-82 years, who were free of cardiovascular disease and cancer. Participants were followed through mailed biennial questionnaires that ascertained medical history, lifestyle, and health-related behaviors. Cox proportional hazards models were used to estimate relative risks and 95% confidence intervals for CHD, adjusted for demographic, diet, lifestyle, and other CHD risk factors.
Results:
Participants who did not report eating breakfast were younger than those who did, and were more likely to be smokers, to work full-time, to be unmarried, to be less physically active, and to drink more alcohol. Men who reported that they ate late at night were more likely to smoke, to sleep <7 hours a night, or to have baseline hypertension compared with men who did not eat late at night. The late-night eating abstainers were more likely to be married and to work full-time, and ate on average one time less per day than the late-night eaters. The mean diet quality of the participants was high among participants, regardless of their breakfast or late-night eating status. During 16 years of follow-up, 1,527 incident CHD cases were diagnosed. Men who skipped breakfast had a 27% higher risk of CHD compared with men who did not (relative risk, 1.27; 95% confidence interval, 1.06-1.53). Compared with men who did not eat late at night, those who ate late at night had a 55% higher CHD risk (relative risk, 1.55; 95% confidence interval, 1.05-2.29). These associations were mediated by body mass index, hypertension, hypercholesterolemia, and diabetes mellitus. No association was observed between eating frequency (times per day) and risk of CHD.
Conclusions:
The investigators concluded that eating breakfast was associated with significantly lower CHD risk in this cohort of male health professionals.
Perspective:
These data suggest that time of meals is associated with other lifestyle behaviors. Adjustment for body mass index, hypercholesterolemia, hypertension, and diabetes [resulted in the relationship between breakfast (and late-night meals) and CHD no longer being significant.] Physicians may use this information to assist in the identification of those who may be at risk and need to improve lifestyle habits. However, it is unlikely that eating breakfast by itself would confer significant protection against heart disease.

Full text available at http://circ.ahajournals.org/content/128/4/337

Related blog post:

Skipping breakfast –boomerang effect for obesity | gutsandgrowth

Global Disease Burden

In 1991, the World Bank and the World Health Organization launched the Global Burden of Disease Study.  A recent article reviews the key findings (NEJM 2013; 369: 448-57).

The goals of the study are to compare the burden of one disease with others; as such, it is “necessary to consider the age at death and life expectancy of persons affected by each disease and to take account of the degree of disability (eg. discomfort, pain, or functional limitations.”  A comprehensive measure of disability, disability-adjusted life-years or DALYs, was used for comparisons.

The study examined 291 types of diseases and injuries as well as 67 risk factors in 187 countries, looking at the years 1990, 2005, and 2010.

Findings:

  • In 2010, there were 2482 million DALYs which is a decrease of 0.6% from 1990.  On the basis of population growth, DALYs would have increased by 37.9% without improvements in disease burden.
  • Major causes of death in 2010: Ischemic heart disease-far ahead #1 (21.1% of deaths, 7850 thousand DALYs), Stroke (6.5% of deaths, 2574 thousand DALYs), Lung/airway cancer (6.1% of deaths, 3033 thousand DALYs), Alzheimer’s (5.9% of deaths, 2022 thousand DALYs), COPD (5.8% of deaths, 3659 thousand DALYs).
  • Global DALYs in 2010 (top ten -starting with #1): Ischemic heart disease, Lower respiratory tract infections, stroke, diarrhea, HIV-AIDs, Malaria, Low Back pain, Preterm birth complications, COPD, and road-traffic injury.
  • Top risk factors (starting with #1): High blood pressure, tobacco smoking (including 2nd-hand smoke), household air pollution, diet low in fruit, alcohol use, high body-mass index, high fasting plasma glucose level, childhood underweight, exposure to outside pollution, physical inactivity, diet high in sodium

Since 1990, there has been a shift.  “In general, communicable, maternal, neonatal, and nutritional conditions decreased in absolute terms.”  The main exceptions were HIV and malaria. Noncommunicable diseases, especially diabetes, have been increasing in terms of percentage and absolute numbers.

Another important change has been a relative increase in disability compared with premature death.  In addition, of the “top 25 causes of years lived with disability, only COPD, diabetes, road-traffic injury, ischemic heart disease, and diarrhea are also among the tope 25 causes of years of life lost.”  “What ails most persons is not necessarily what kills them.”

Bottom-line: While collecting this type of data has many potential limitations, the broad picture it provides should help inform policymakers with priorities for research and intervention.  This data also allows the US to benchmark its efforts compared to other countries.  For example, according to the authors, currently the US has the best global performance with respect to stroke and the worst with respect to lung cancer and Alzheimer’s disease; however, “data and analyses are lacking to elucidate the drivers of these changes in relative performance.”

Preventing Type 2 Diabetes

A ‘perspective’ article reviews data from several studies that show the efficacy of medical treatments aimed at preventing type 2 diabetes (NEJM 2012; 367: 1177-79).

The Diabetes Prevention Program (DPP) was a comparative effectiveness trial of 3234 overweight or obese adults with impaired glucose tolerance (prediabetes).  Findings from this study (published in 2002) showed that lifestyle intervention (attempts at weight loss through diet and exercise) reduced conversion to diabetes by 58% over 3 years, whereas metformin reduced this conversion by 31% over 2 years.  Lifestyle intervention worked best in patients ≥ 60 years.

Subsequently, 88% of these subjects were enrolled in the 10-year outcome study (DPPOS).  The lifestyle intervention group had a 31% 10-year reduction in diabetes compared with 18% for metformin.

The editorial points out that there have been efforts to expand these results across the country through CDC-sponsored programs in cooperation with the YMCA and UnitedHealth.

Potential roadblocks remain:

  • Most payers do not cover these preventive services.
  • US Preventive Services Task Force (USPSTF) has not issued a recommendation on these services.  this affects both public and private insurance coverage.
  • Metformin which may be useful in younger populations does not have a specific indication for diabetes prevention from the FDA (off-label use only).

Whether prevention is ‘worth a pound of cure’ may be hard to discern with prediabetes.    Since the peak incidence of diabetes is between 50 and 60 years and complications often emerge more than a decade later, the benefits of preventing diabetes may not be fully apparent for quite a long time.

Related blog entries:

Treating diabetes with surgery | gutsandgrowth

Lower leptin with physical activity | gutsandgrowth

Staggering cost of obesity | gutsandgrowth