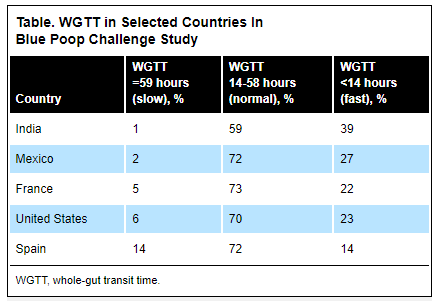
The “Blue Poop Challenge,” (joinzoe.com/bluepoop), a citizen scientist project involving 21,541 volunteers in 17 countries on five continents, is evaluating whole gut transit time (WGTT). “Findings were based on self-reported WGTT after volunteers consumed blue muffins (84.5 g per muffin x 2, each containing 0.75 g of blue food coloring paste). WGTT was defined as the time elapsing between muffin ingestion and first appearance of blue color in the stool…”
“The mean WGTT was 23.9 hours (range, 16.2- 32.0 hours), with country-specific differences, said Dr. Bulsiewicz, reporting the findings at Digestive Disease Week 2023 (abstract Su1612)“…
“Fast and slow WGTTs were significantly associated with less healthful diet quality compared with normal WGTT (P<0.001). ‘Lower intakes of plant-based foods were associated with abnormal transit times, which is consistent with the known effect of dietary fiber,‘”‘”
My take: Food-based transit studies are a lot easier to perform than Sitz marker studies. And, of course, who would not want to know if their transit time is faster than their friends?
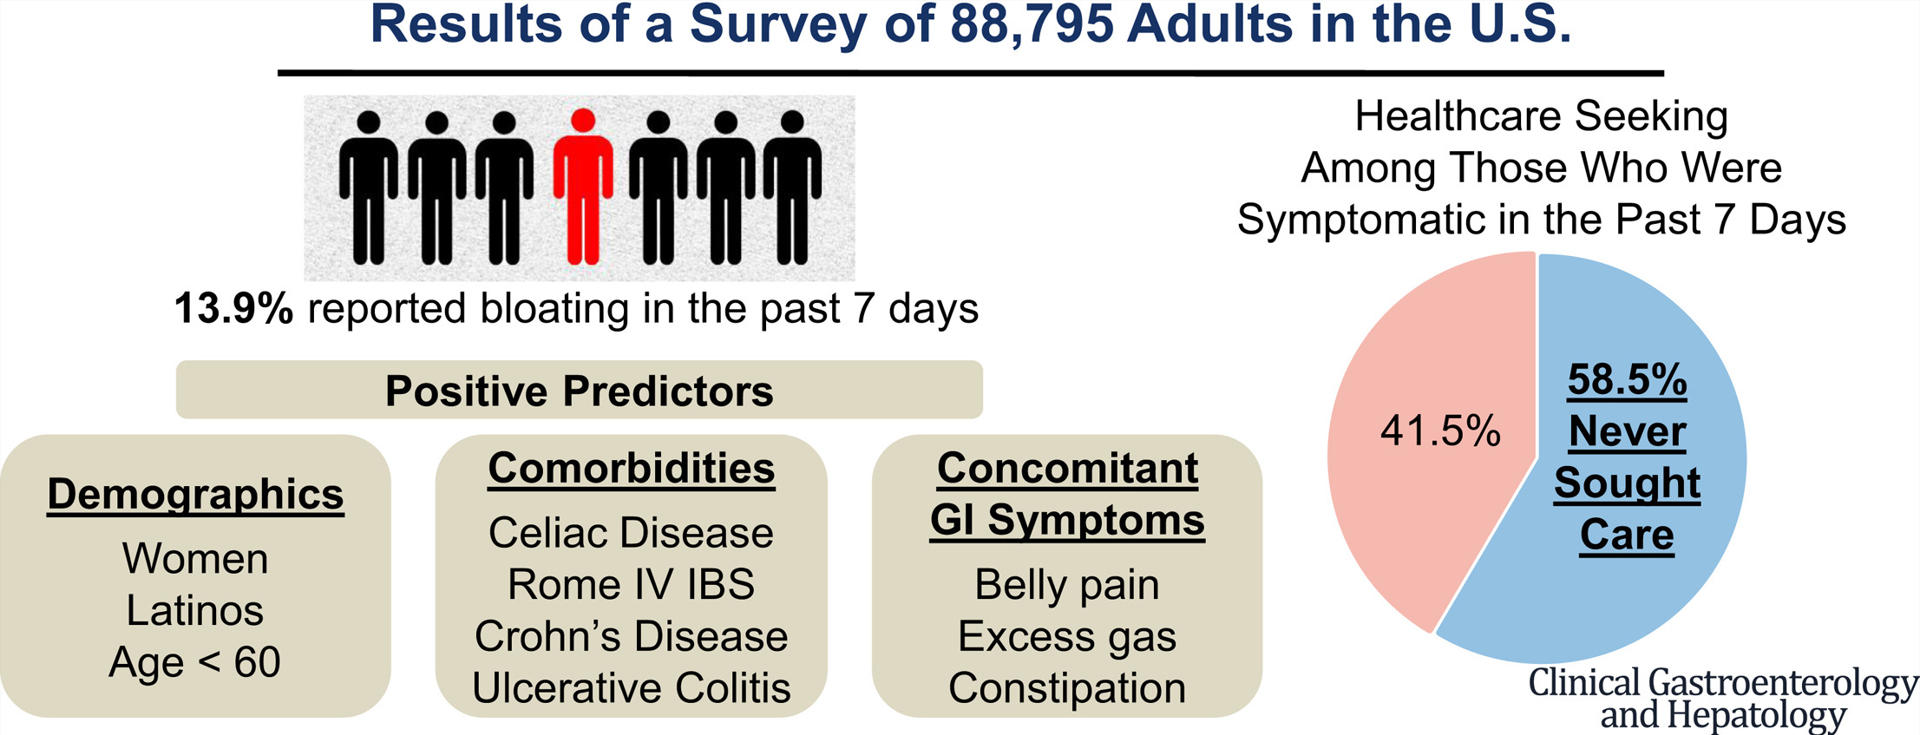
88,795 completed surveys detailing prevalence of bloating in preceding 7 days.
Key findings:
Nearly 1 in 7 (12,324 (13.9%) Americans have experienced bloating symptom in the past week; 58.5% never sought care for bloating—29% of whom were self-managing symptoms or were uncomfortable discussing symptoms with their providers
Women and those with comorbidities (eg, irritable bowel syndrome, chronic constipation, ulcerative colitis) and concomitant GI symptoms (eg, abdominal pain, excess gas) had higher odds for bloating (all P < .001) and severe bloating (all P < .001
My take: This study shows that a lot individuals have bloating.
In this prospective cohort with a colic group (n=46) and a control group (n=49), the key findings:
“In the melatonin analysis, the difference between day and night levels was significant in the control group, indicating an established circadian rhythm (P = 0.014). In the colic group, there was no day-night difference (P = 0.216) in melatonin, but serotonin levels were higher at night.”
“Day-night variability of H3f3b mRNA levels between the groups was significant, indicating circadian rhythm disturbance in the colic group compared to the control group (P = 0.003).”
The authors note that migraine “has recently been discovered as one of the disease related to biorhythm regulation.” For colic, the authors propose that increases in serotonin, which can cause intestinal distress, contribute to colic, particularly when this is unopposed by increases in melatonin. “Serotonin-melatonin counterbalancing system in the gastrointestinal system generally develops around 3 monhts, and serotonin causes painful intestinal cramps and crying in the evening.”
H3f3b is “expressed in peripheral buccal tissue and is thought to reflect the activity of the central clock.”
My take: If this study is confirmed by others, it could lead to diagnostic testing for colic. Perhaps, then reflux would not be blamed for causing screaming babies. Though, I doubt any effective treatments would be available for biorhythm disturbances in this age group due to safety concerns.
This article describes the terms “moral injury” and “moral distress” which contribute to job dissatisfaction for physicians.
Here are excerpts:
The terms “moral distress” and “moral injury” were first used in a military context to characterize the torment felt by soldiers as they tried to process and justify their actions amid the cruelty of war. In more recent years, these terms have been used to describe the feelings of guilt, sadness and defeat felt by health care professionals when we know what our patients need but can’t provide it...
At Austin’s CD Doyle clinic for people who are homeless, where I volunteer, nearly every patient has unmet needs impacting their health…Even in well-resourced private clinics, doctors often feel frustrated that they can’t spend time with patients who need it and have little control over their schedules…
Doctors struggle to meet productivity demands, rushing in and out of exam rooms, working late into the evening to finish documenting in cumbersome electronic medical record systems. Despite some efforts to move away from a “fee-for-service” payment model, in most cases, our system still rewards volume of patients seen over value of care provided…
In Texas and other states, recent legislation, such as abortion bans and prohibitions against gender-affirming care for trans-youth, have introduced new moral dilemmas for doctors. We want to do right by our patients but face added barriers – even the potential for jail time – if we overreach or misinterpret the laws…
A commitment from health care leaders, health insurance plans, and all levels of government to address the nonmedical conditions in which we live, work, learn and play — the social determinants of health that drive 80% to 90% of health outcomes on a population level – would improve the health of individuals and communities. It would also decrease the pressure on doctors to treat medical conditions stemming from unhealthy environments that we can’t change.
A survey published last fall in Mayo Clinic Proceedings showed an alarming increase in physician burnout, with 62.8% of respondents reporting at least one symptom in 2021 compared to just 38.2% in 2020.
Physicians, too, face rates of depression and suicide that are higher than the among the general population. While moral distress doesn’t fully account for the difference, it is a contributing factor for some.
My take: My role as a physician is often constrained by troubling factors out of my control including lack of resources and poor social situations.
“That’s all well and good in practice… but how does it work in theory?” I saw this quote many years ago when I was visiting the University of Chicago.
This quote came to mind as I was reading this article which showed relatively little change in the efficacy between more and less stringent elimination diets for eosinophilic esophagitis. This meta-analysis included 915 children and 847 adults and assessed the efficacy rates of 4 major dietary treatment regimens in eosinophilic esophagitis: 6-food (SFED), 4-food (FFED), 1-food (OFED), and a targeted elimination diet (TED).
Key findings:
The overall rate of histologic remission was 53.8% and in the individual dietary groups was 61.3% for SFED, 49.4% for FFED, 51.4% for OFED, and 45.7% for TED.
The overall rate of clinical response was 80.8%, with response rates of 92.8% for SFED, 74.1% for FFED, 87.1% for OFED, and 69.0% for TED.
Percentage of food antigen triggers identified via endoscopic and clinical evaluation after food re-introduction.
My take: It is clear to me that more restrictive diets can yield better response rates; however, in clinical practice they are difficult to maintain and this study shows that the improvement with more food restrictions may be quite limited.
Another reference on eosinophilic esophagitis: CJ Ketchem et al. Clin Gastroenterol Hepatol. 2023 Aug;21(9):2252-2259. Open Access! Higher Body Mass Index Is Associated With Decreased Treatment Response to Topical Steroids in Eosinophilic Esophagitis. Key finding: Histologic response (n=296) to topic steroids was higher for those who were nonobese compared with obese at fewer than 15 eosinophils per high-power field (61% vs 47%; P = .049); in addition, nonobese patients had significantly greater endoscopic and symptomatic responses.
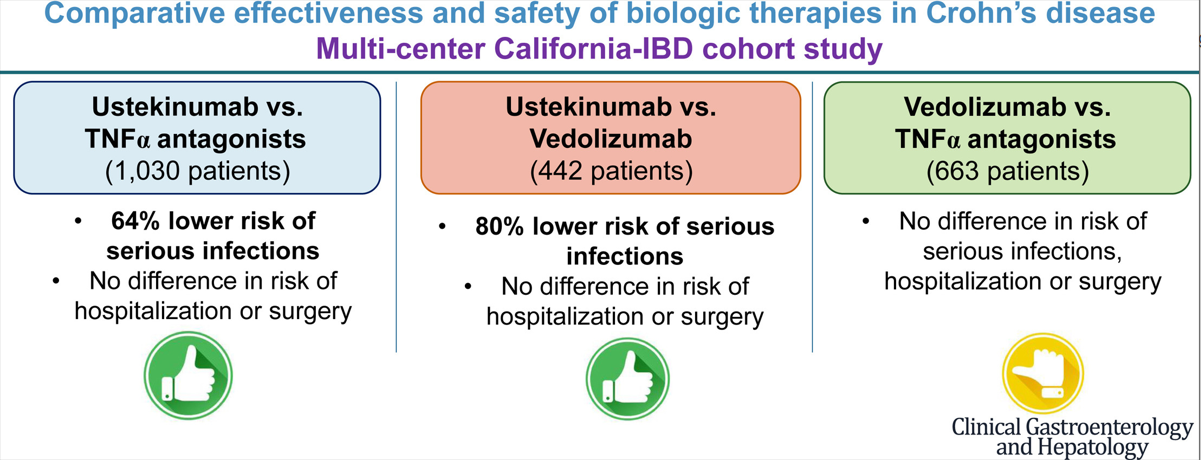
There is limited head-to-head data comparing the effectiveness of the biologics used for inflammatory bowel disease. In this study, the authors used a “series of propensity score (PS)-matched cohort studies comparing TNF-α antagonists vs vedolizumab vs ustekinumab in a large, diverse, multicenter, electronic health record (EHR)-based cohort.”
This graphical abstract summarizes the findings, though the first cohort (ustekinumab vs TNFalpha population is actually 1545 not 1030):
Key findings:
Ustekinumab-treated patients with CD (n = 515) experienced a lower risk of serious infections (hazard ratio [HR], 0.36), without any difference in the risk of hospitalization (HR, 0.99) or surgery (HR, 1.08) -compared to patients receiving TNF alpha antagonists (n=1030)
Ustekinumab-treated patients with CD (n = 221) experienced a lower risk of serious infections (HR, 0.20), without significant differences in risk of hospitalization (HR, 0.76) or surgery (HR, 1.42) -compared to vedolizumab-treated patients (n=221)
Compared with TNF-α antagonists (n = 442), vedolizumab-treated patients with CD (n = 221) had a similar risk of serious infections (HR, 1.53), hospitalization (HR, 1.32), and surgery (HR, 0.63).
The increase rate of infections with vedolizumab compared to ustekinumab could be an indication of lower efficacy with vedolizumab as the medication itself has a high safety profile.
In the discussion, the authors comment further on head-to-head studies and lack of these as well. “Biemans et al23 observed that ustekinumab-treated patients were more likely to achieve corticosteroid-free clinical remission (69 patients in each arm, vs vedolizumab; 46.4% vs 29.0%; P = .04) and biochemical remission (42.1% vs 13.2%; P = .01) at 12 months, although these rates were not significant at earlier time points.”
My take: This study provides further evidence that ustekinumab is a good option for Crohn’s disease with regard to both safety and efficacy.
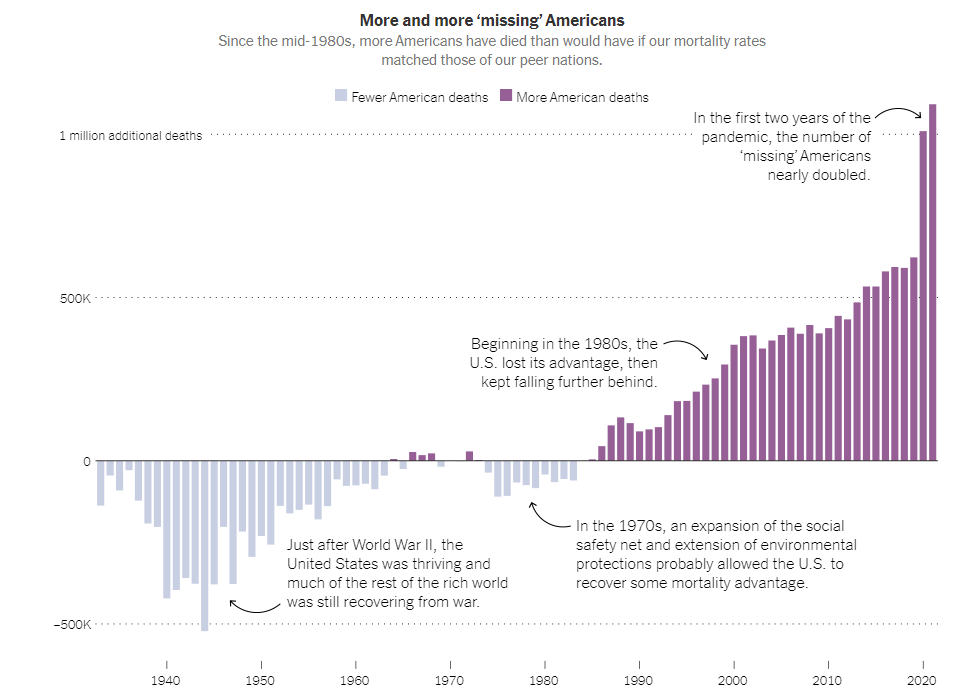
A previous blog post (Life Expectancy Dropping in U.S.) showed an alarming trend in which the life expectancy in the U.S. has dropped to about 76 years, nearly 6 years lower than peer countries
“Life expectancy in the United States took an unprecedented turn for the worse, placing it not among its wealthy peers, but below Kosovo, Albania, Sri Lanka and Algeria (and just ahead of Panama, Turkey and Lebanon)…
But the loss is jaw-dropping by another measure — the sheer number of needless deaths. Before the pandemic, roughly a half million more people in America died each year than would have died, on average, in wealthy peer countries. In each of the first two years of the pandemic, the number surpassed one million….
The much larger American anomaly is its deaths among the young and middle-aged — among whom violent deaths, in particular, subtract many more years of life than would almost any natural cause of death, which overwhelmingly strikes much later in life.”
The article describes areas with excess deaths including the following:
Overdose deaths
Gun-related deaths (accidents, suicides, and homicides)
Excess car deaths
Accidents (including increased deaths from fires and drowning)
Maternal deaths during childbirth
Deaths related to chronic disease including diabetes (associated with obesity)
My take: The excess number of U.S. population dying every year is staggering and sadly, little is being done to change it.
G Bai et al. NEJM 2023; 389: 196-197. Do Nonprofit Hospitals Deserve Their Tax Exemption?
Excerpts:
Roughly 60% of community hospitals are incorporated as nonprofit institutions, which means that they don’t have shareholders and cannot distribute dividends…Nonprofit status doesn’t automatically confer tax exemption. Section 501(c)(3) of the Internal Revenue Code authorizes tax exemption for nonprofit organizations pursuing charitable, religious, educational, or scientific missions…In 1969, the IRS adopted the community-benefit standard, which required nonprofit hospitals to promote “the health of a class of persons that is broad enough to benefit the community.”…
An analysis by the Kaiser Family Foundation estimated that the value of nonprofit hospitals’ tax exemption was $28.1 billion in 2020…In 2018, for every $100 of expenses incurred, nonprofit hospitals in aggregate spent $2.30 on charity care, as compared with $3.80 spent by for-profit hospitals. And in 2019, nonprofit and for-profit hospitals had similar Medicaid shortfalls as a share of total expenses…
Many nonprofit hospitals also generate substantial profits from the federal 340B Drug Pricing Program. The 340B program… was designed to help safety-net hospitals serve low-income patients…
Some hospitals have also adopted aggressive revenue enhancing activities, such as declining to offer charity care to eligible patients and suing patients and garnishing wages because of unpaid medical bills. These examples make it clear that nonprofit status provides no assurance that hospitals will behave in accordance with their charitable mission or provide sufficient community benefit to justify favored tax status…
Disclosure might not be sufficient to catalyze changes in hospital behavior, but we believe greater visibility is a prerequisite for policy action…Many nonprofit hospitals face substantial fiscal challenges, so heavy-handed policies — such as eliminating tax-exempt status across the board — are likely to be counterproductive…Mandating increased financial transparency would give stakeholders and policymakers the flexibility to understand, design, and test approaches to encourage nonprofit hospitals to provide meaningful community benefit
My take: This commentary piece makes a strong argument that many nonprofit hospitals do not deserve to be exempt from taxes.
Related blog posts:
Have Nonprofit Hospitals Lost Their Mission?The average chief executive’s package at nonprofit hospitals is worth $3.5 million annually.…Particularly in communities with a shortage of health care resources, tax exemption can make sense. In medically saturated areas, where profits and executive compensation approach Wall Street levels, tax exemption should raise eyebrows.
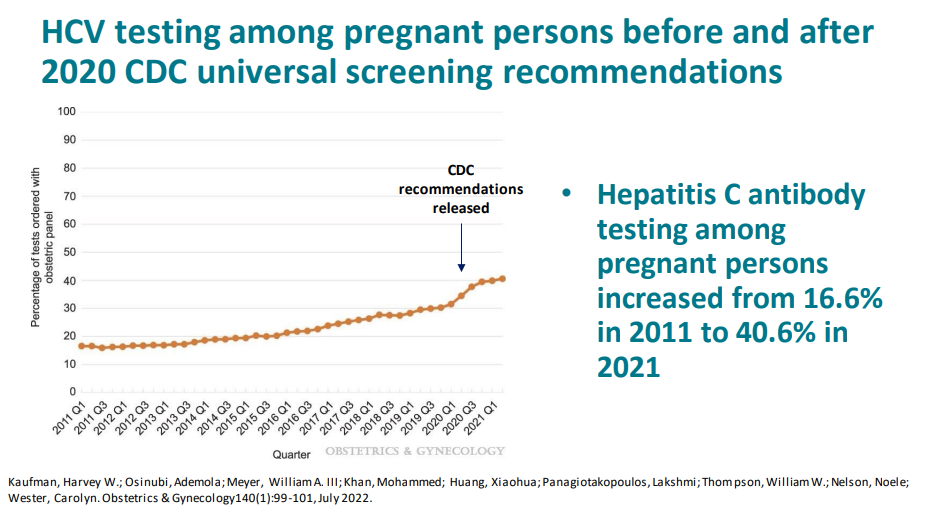
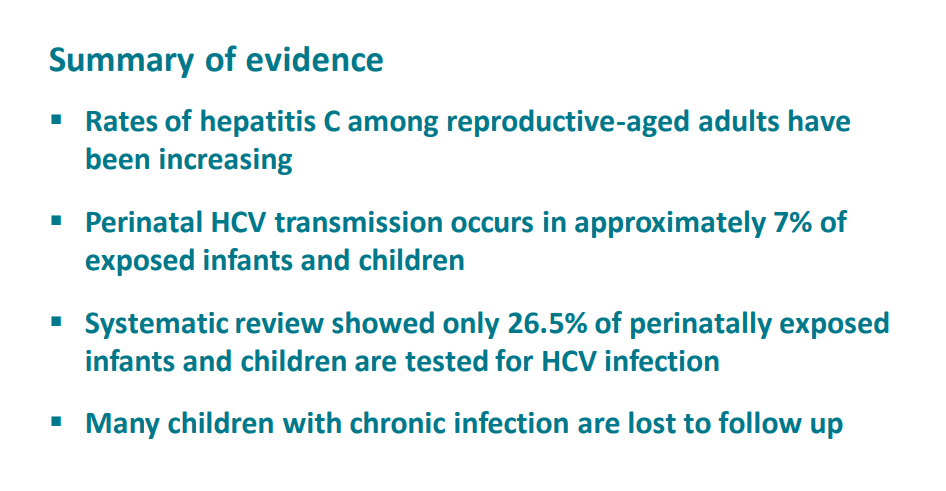
In this study, the authors modeled three strategies for screening for Hepatitis C infection in children and compared to baseline testing (current approach): : anti-HCV with reflex to HCV RNA at 18 months among children known to be perinatally exposed.
New strategies:
#1: HCV RNA testing at 2-6 months among infants known to be perinatally exposed
#2 universal anti-HCV with reflex to HCV RNA at 18 months among all children
#3 universal HCV RNA testing at 2-6 months among all infants
Key findings:
Each of the 3 alternative testing strategies resulted in an increased number of children tested and improved health outcomes. HCV RNA testing at 2-6 months (test strategy 1) was cost-saving and resulted in a population-level difference in cost of $469 671.
More testing in each of the universal comparison strategies resulted in increased QALYs, but also over $38 million to over $129 million
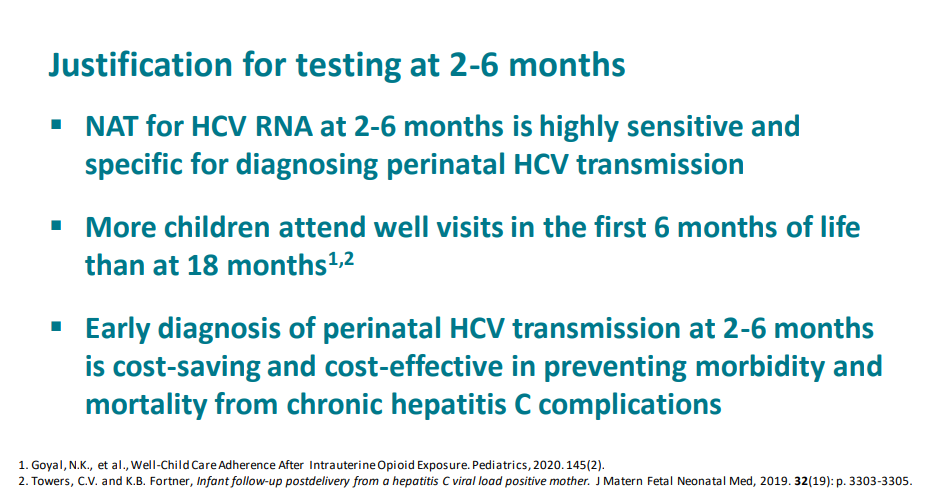
In the discussion, the authors elaborate on why testing at 2-6 months is now the best approach:
“Factors driving these results include pediatric loss to follow up at older ages, high attendance at well-child visits in the first 6 months of life, and highly sensitive nucleic acid testing with reliable results starting at age 2 months.”
“One study assessing >150 000 children at 2 health networks spanning 20 states determined children rarely missed 2-month, 4-month, and 6-month well-care visits, whereas 15-month and 18-month visits were attended by less than one-half of publicly insured children”
Current recommendations are for all pregnant women receive HCV screening, though currently it is below 50%. The universal testing strategy becomes more cost prohibitive as more women receive HCV testing in pregnancy
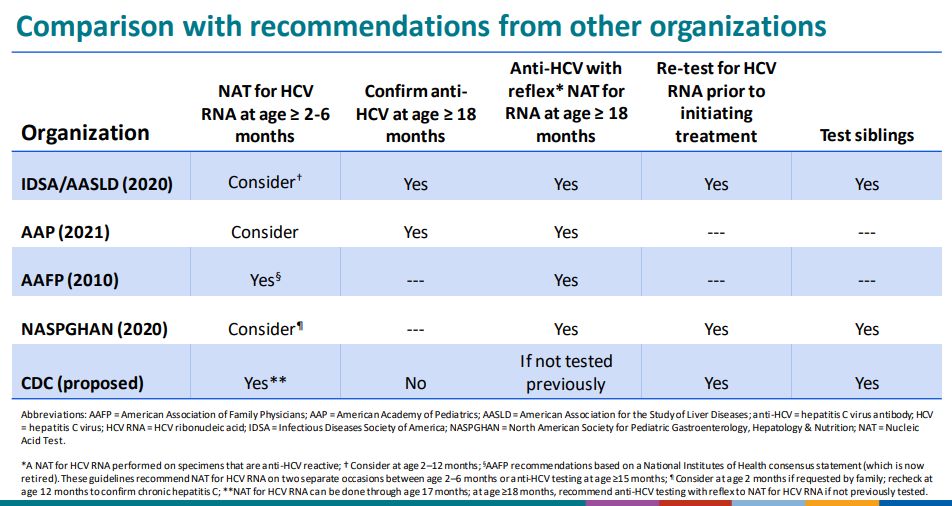
The CDC has undertaken a review and is likely to implement the 2-6 month old testing strategy as a recommendation. The authors of this study are involved in this process. A slide set reviewing the draft recommendations from 12/6/22:
My take (borrowed from authors): Testing of perinatally exposed infants at age 2-6 months with a single HCV RNA test will reduce costs and improve health outcomes.
The authors identifed 25 studies which met inclusion criteria. Key findings:
In the analysis of studies with 3-category outcomes (n = 13), the pooled frequencies of patients (n=646) with improved, unchanged, or aggravated IBD course after LT were 29.4%, 51.4% (, and 25.2%.
Subgroup analyses revealed that patients with ulcerative colitis (UC), younger age at LT, or shorter duration of follow-up were more likely to have an improved disease course.
In the analysis of studies with 2-category outcomes (n = 12), the pooled frequencies of patients (n=672) with improved/unchanged or aggravated IBD course were 73.6% and 24.1%, respectively
My take: Despite the intensification of immunosuppression, most often the course of IBD is unchanged in patients following a liver transplantation.